How do we effectively monitor all the video data we process?
Accurately analysing video content requires a vast and diverse deluge of data. Here we’ll walk through how we’ve systematically structured and categorised our services, to get greater visibility and control over what we ship.
At Media Distillery, we analyse approximately 20,000 hours of video content per day. We structure our analysis service by splitting it up into [microservices], meaning there are many components involved in analysing one piece of video.
Speech, face, logo, topic recogniser services and more trivial services such as dashboards, authentication interact simultaneously to achieve a single goal: extract valuable information out of video in real-time. At this scale, when things go wrong it’s hard to figure out what exactly went wrong. Reasoning in terms of inputs and outputs is not enough, and in the end we don’t have the full story.
Did we record the wrong thing or was it the configuration of one of the many services involved in the processing pipeline? Could it have been a bug in the code?
Manually tracing the pipeline to find the culprit is a time-consuming and scrupulous task. How can we get a full, cohesive picture of what is happening to the video content inside our platform? Finding a systematic way of answering these kinds of questions has become a necessity.
So we thought about the structure of the content and the processing pipeline. What do we want to get out of it? All content is broken down into three different categories:
- Video chunks: transcoded and stored
- Audio chunks: served to the speech recogniser and stored
- Video frames: served to our analysis services, for instance to the logo recogniser
In order to find out what happens to the content, we need to keep track of the components above while they pass through relevant points in the system. Such important points are:
*When the content is broken down into the components above
*When an error is caught by a service
*When the speech recogniser returns the analysis results
*When the logo recogniser returns the analysis results
*When the content is stored
Here are some methods we use to keep track of the categories mentioned above (1,2,3) according to the relevant touchpoints (*).
1. Content-centric logs
Logging is the process of recording each event that a process or service generates as a single line of text in a file, ordered by time. It is a powerful method that helps with debugging services. By shifting the focus away from services and processes, we recorded a line of text every time the content passed the points above. Every line of text reports a single piece of information and has a timestamp attached.

Fig.1 Content-centric logs
The content-centric logs are collected in a central place where we can simply process texts and distill important information such as latency between two operations or the cause of an error. To report the data, we use two different strategies:
- Direct reporting: Data is reported as soon as it’s generated, sending a separate message for every log.
- Piggybacking: Logging data is attached to the content and propagated along the pipeline. It is reported after processing, where a separate service captures the communication flow and automatically extracts the tracing data.
2. Distributed tracing
There is significant effort needed to make sense of the content-centric logs. While they are reported to a central place, we still need to connect them using the first part of the logs in order to have an overview. Moreover, with every new type of metric reported or new content structure, we need to deploy new versions of the code that build them accordingly.
Distributed tracing is a method used to profile and monitor the communication of highly distributed applications, especially the ones built using a microservices architecture. Incoming requests are traced as they hop from one service to another; various metadata is collected along the way in a central place; and the result is an aggregation that tells the whole story about how a request flowed through the system.
Well, we wanted to tell the exact same story about the video content we analyse. By shifting the focus from the communication flow to the content, we tried to apply distributed tracing.
2.1 OpenTracing
OpenTracing is the leading standard on [distributed tracing] instrumentation. Similarly to the logging method, we had to define the kind of story we wanted to extract out of the system and modify the codebase accordingly. OpenTracing fixed the following:
* Every operation has some context information attached
* The API is powerful, allowing us to report any kind of metric
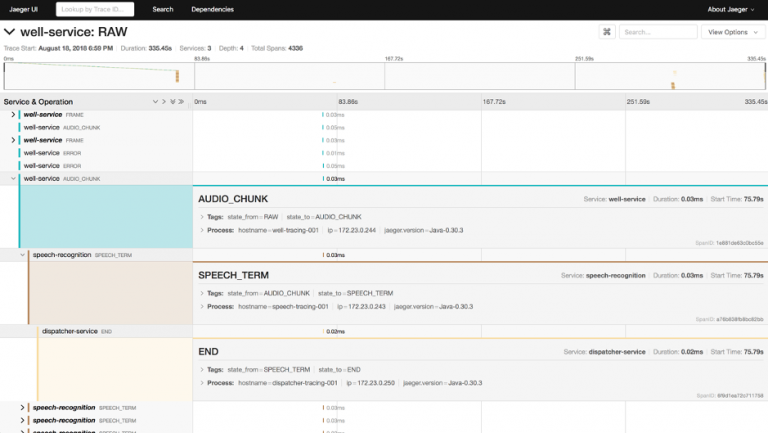
Fig.2 Sample output using OpenTracing and Jaeger on a piece of audio that goes through speech processing
Drawbacks
With the two methods described above, the best results come only after a good understanding of the codebase, platform, infrastructure and the business. Moreover, the effort of incorporating these methods is significant. Simply put, tracing or logging content-centric data has got to become part of the development process. This is because engineers know the intricacies of the features they develop while they develop them.
2.2 Adapting the processing pipeline
All the data we process is fairly standardised. It consists of video data, and variations come from different resolutions and codecs. Therefore, all messages that flow through the system are standardised in the form of an annotation, and all reference a piece of content.
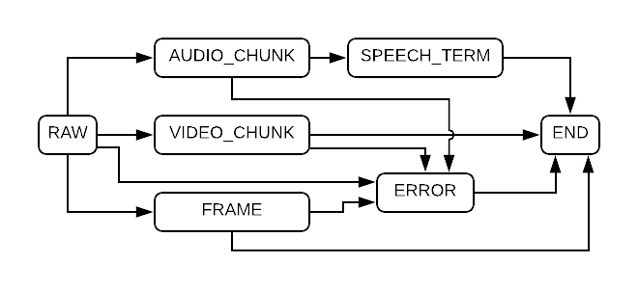
Fig.3 Sample automaton that applies speech recognition over a piece of video. Notice how frames and videos do not have a result. Instead, they go straight to the ERROR state.
Incoming data is broken down by the recording services, which is then sent forwards to be processed. To all data packets, we attach an automaton that specifies and dictates the analysis it will undergo. It contains a set of states, a collection of transitions between states, a start state and a collection of possible end states.
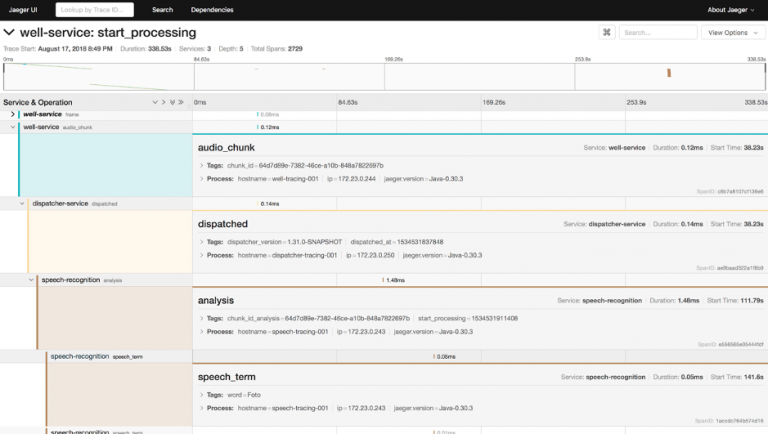
Fig.4 Sample output using OpenTracing and Jaeger on a piece of audio that goes through speech processing using automata
Services that receive the packet are responsible for performing the analysis and then updating the automaton to the next state. No matter their state, all packets are picked up by a dispatcher service that routes them to the destination based on the current state of the automaton. This way we extracted the responsibility of knowing the next step in the pipeline from each microservice.
And to achieve content-centric tracing, we only instrument the point where services change the state of the automaton.
Content-centricity distilled
Understanding our system’s behaviour was a bigger challenge than we anticipated, but along the journey we gained a lot of valuable insight. The effort showed us the importance of integrating such an initiative from the early stages of the development. Expanding coverage by using OpenTracing or building simple logs was tedious but it inspired us to push forward as results were promising. Having a concise overview of our system’s behaviour was closer, however still incomplete.
We ended up challenging the core architecture and we not only gained a clear picture of what happens to the video in our system, but ended up with cleaner and more cohesive services that communicate in an even more unified way, while expanding tracing coverage automatically.
March 25, 2020